
The Missoula residential real estate market realized 72 home sales in November. Despite the seasonal decline in sales over the last few months, Missoula’s residential real estate market is about 14.5 percent ahead of last year on a year-to-date basis. At the end of November there were 360 active residential homes listed for sale in the Missoula market, which is a 7.9 percent decrease compared to last month and flat compared to the same month last year. Under contract figures ended the month quite a bit lower than in the prior month, indicating that a large number of properties that went under contract in October actually closed in November, rather than the sales cancelling or failing. Average lender rates for mortgages have been increasing steadily and, if rates continue to rise, we anticipate it having a downward pull on affordability for buyers in the market for a new home.
Supply & Demand:
The inventory of homes decreased to 360 active homes on the market at the end of November. This is lower inventory than last month but comparable to the same month last year. Listing activity typically begins to decrease after school begins and the cold weather sets in. With summer winding down and the commencement of the school year, we did see the typical, seasonal decline in sales. The Missoula market realized 72 residential sales this November.
Compared to last month and the same month last year, November under contract numbers were down as the month closed out. Average sold price for the month was approximately $251,013, and sellers averaged approximately 98 percent of asking price.
Price Range:
Overall, approximately 22.4 percent of inventory turned over this month, compared to 20.4 percent last month and 18.4 percent in September. Most of the activity (roughly 86 percent) occurred in the under $350,000 price range.
Days on Market (DOM):
This November homes were on the market for an average of 112 days before being sold, not including relisting. (It is important to note that the average DOM figure is slightly skewed because each time a property is relisted, the DOM resets to zero.)
Foreclosure/Bank Owned (REO):
Short sale and REO properties accounted for approximately 3 percent of the active residential listings again this month. At the end of November, the MLS was reporting 7 active short sales and 5 bank-owned properties out of a total of 360 single-family listings. The last three months have reflected the lowest number of short sale and REO properties on the market in any given month since we started tracking them at the beginning of 2011.
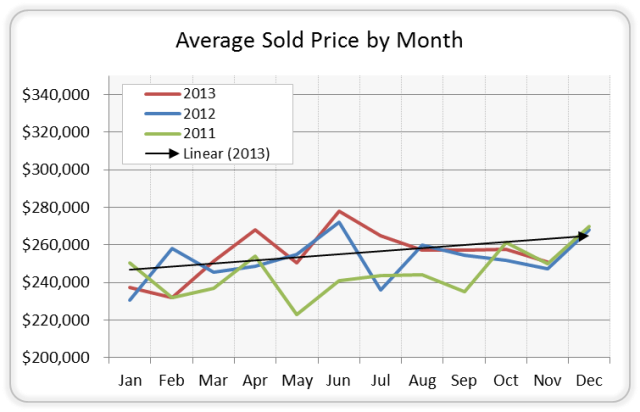
Average Sold Price:
Average sold price in November was $251,013. While this figure has been decreasing slightly each month since June, overall average sold price has trended higher in 2013 than in the last two years.
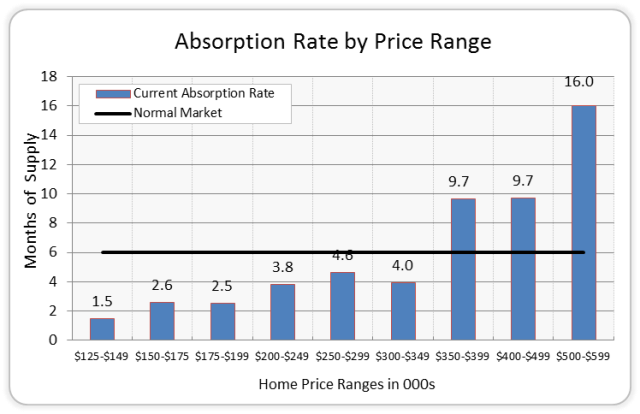
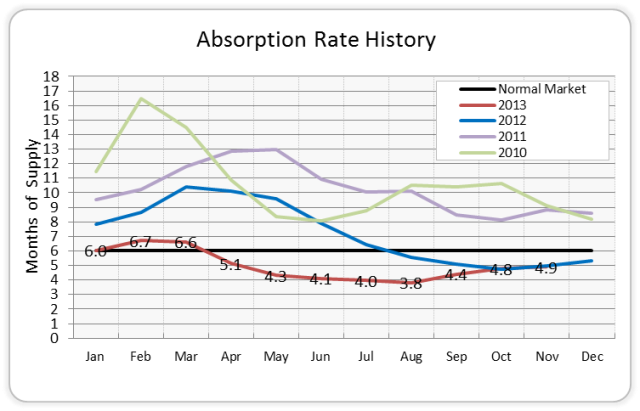
Absorption Rate:
The health of any real estate market can be recorded by absorption rates, which is the correlation between the number of active homes on the market and the number that sell per month, on average. According to the National Association of Realtors, a normal market is six months of inventory.
For the purposes of the following two graphs, we are utilizing a 3-month average for sales, rather than 12 months, in an effort to demonstrate the current, short-term absorption rate. Overall, the Missoula market continues to perform quite a bit better than a normal market with an absorption rate of 4.9 months in November. If more homes continue to come on the market as we move into winter, we anticipate seeing the absorption rate deteriorate slightly and move toward a more normal market. However, if inventory levels stagnate we don’t anticipate seeing the absorption rate deteriorating unless there is a significant decline in sales.
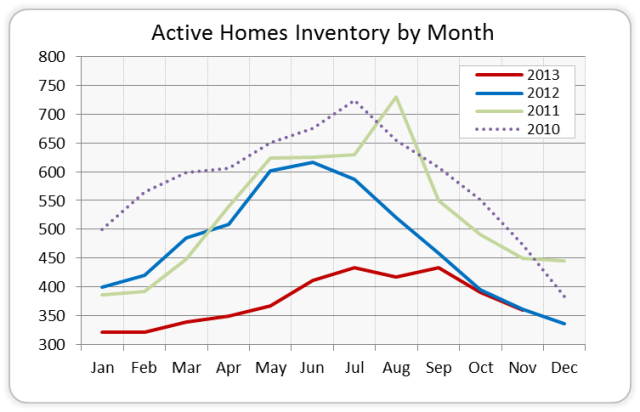
Inventory of Homes Listed for Sale:
Over the last year Missoula has had a shortage of homes on the market. Even with the increase in inventory over the summer, inventory levels have remained below that of the last three years. At the end of November there were 360 homes listed for sale, representing the lowest number of homes listed for sale in the month of November over the last five years. While we expect inventory to experience the seasonal decline as we head into the winter months, we are hopeful that the level of homes on the market will match or surpass prior year levels as homeowners take advantage of a seller’s market.
The following chart presents the total inventory of homes listed for sale at the end of each month since January 2010.
 A low absorption rate in your price range may indicate an opportunity to list at a higher price and, conversely, a higher absorption rate in your price range may put downward pressure on your market value.
Inventory and absorption rates are an indicator for how fast our market is recovering. If the number of homes coming on the market is proportional to the number sold, our market will continue to strengthen. If there is a substantial increase in homes that are not absorbed by the number of buyers in the market, expect our market to soften until they are absorbed by the buyers.
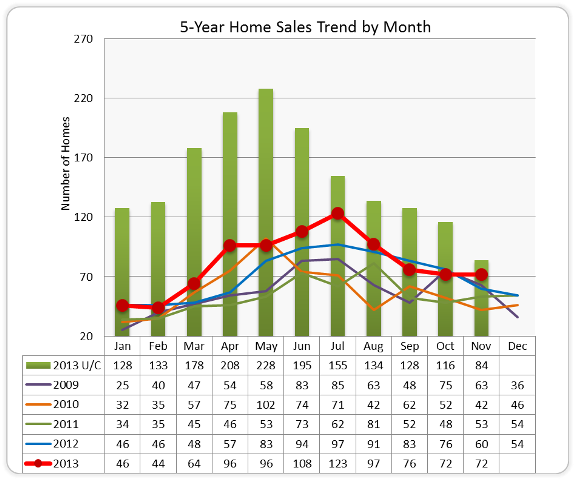
5-Year Home Sales by Month:
Under Contract volume decreased from 116 properties in October to 84 properties in November and sales remained steady at 72 sales. This represents the highest number of sales in November in the last five years.
The following chart provides a monthly snapshot of total homes sold since January 2009. (Green columns represent Under Contract properties for the current year.)
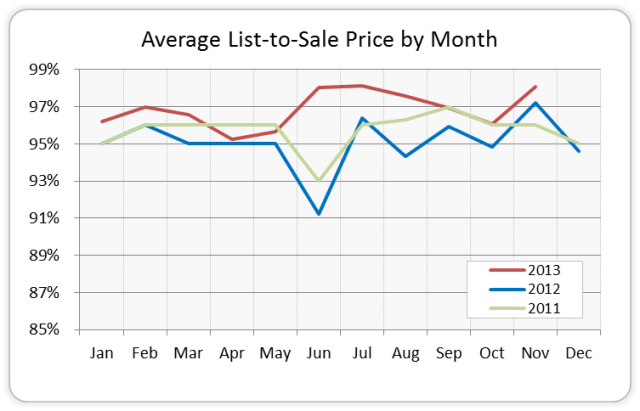
Average List-to-Sale Price:
List-to-sales price signifies pricing trends in the market. For the last couple of years homes have been selling at 95 percent to 96 percent of list price. Over the summer we saw list-to-sales prices of 98 percent and in October it was down slightly to 96 percent. However, in November, list-to-sales price again increased to 98 percent of asking price. (For example, if you sold a home for $100,000, sellers are, on average, accepting offers of $96,000 – $98,000, or between 2 and 4 percent less than asking price.
Overview: When inventory increases, average list-to-sales prices generally decrease due to added competition in the market. When lower list to sales prices are seen, usually in the summer months, it can be attributed to high absorption rates, primarily because during these months there are more homes on the market, meaning more competition. In that scenario, motivated sellers might have to take less for their home in order to beat out the competition.
For several months list-to-sales price has been better than in prior years, hovering between 96 and 97 percent. The lowest list-to-sales ratio this year was in March, when sellers averaged 95 percent of asking price. In June/July/August, this percentage moved up to 98 percent, and moved down slightly to 97 percent this September. List-to-sale price averaged 98 percent this November, compared to 97 percent in November of last year.
The following graph provides the average list-to-sale price, by month, for the last two and a half years:
Buyer Recommendation: Take advantage of interest rates before they rise and be prepared to pay 97-98 percent of asking price, on average. With lower-than-normal inventory, sellers whose homes are competitively priced have been entertaining multiple offers and getting very close to asking price or more than asking price. Prior to beginning or resuming your search, we recommend that you be prepared with a loan pre-approval letter and ready to look at and make an offer on the good homes immediately to avoid possible multiple offer situations.
Seller Recommendation: While inventory has been catching up to prior year levels, inventory is still low enough that we recommend putting/keeping your home on the market. Buyers currently have limited options, creating the possibility of getting an offer close to asking price because supply is not quite meeting demand. However, while it seems that average sold prices could increase a little during this time, it is still very important to price your home reasonably and competitively.